Learn all about the influence of signal distortion in part 2 of the basics of measurement data acquisition & measurement technology

Signal quality is always important. But how much of it is absolutely necessary to be able to make a desired measurement statement?
Even if we all have a certain basic experience, the first gut feeling is usually dramatically wrong. The rarely considered cause for this is: signal distortion.
The correlation is very simple to describe: If a signal is applied to a measuring device, it is (unfortunately) always somewhat distorted in the input stage of the measuring device. Here the signal appears as if there were additional higher frequency interference signals (= harmonics). These are not present in reality, but appear in the measuring device and thus in the measurement results calculated from it. In many measurement tasks, these "virtual interference signals" are exactly at frequencies where the actual measurement signal also shows important information, so that this important information is falsified or in extreme cases even totally superimposed. If a measurement statement is based on these superimposed signal components, false statements are to be expected.
This means that all measuring devices distort the applied measurement signals! Some more, others less. If you want to carry out reliable data acquisition with minimal signal distortion, you should definitely use precision measuring devices. This is the only way to draw reliable conclusions from the measured values.
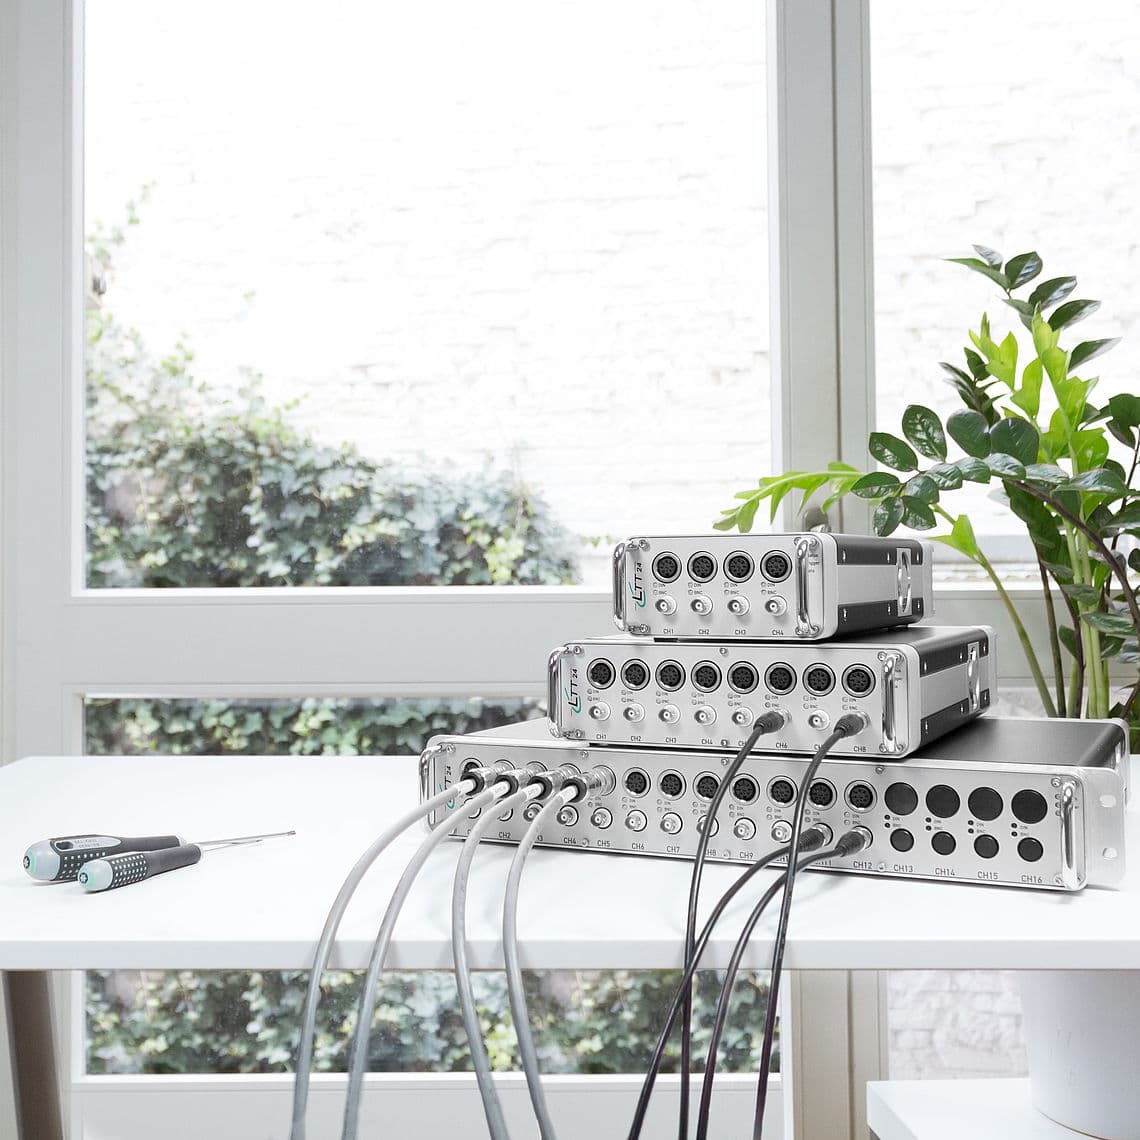
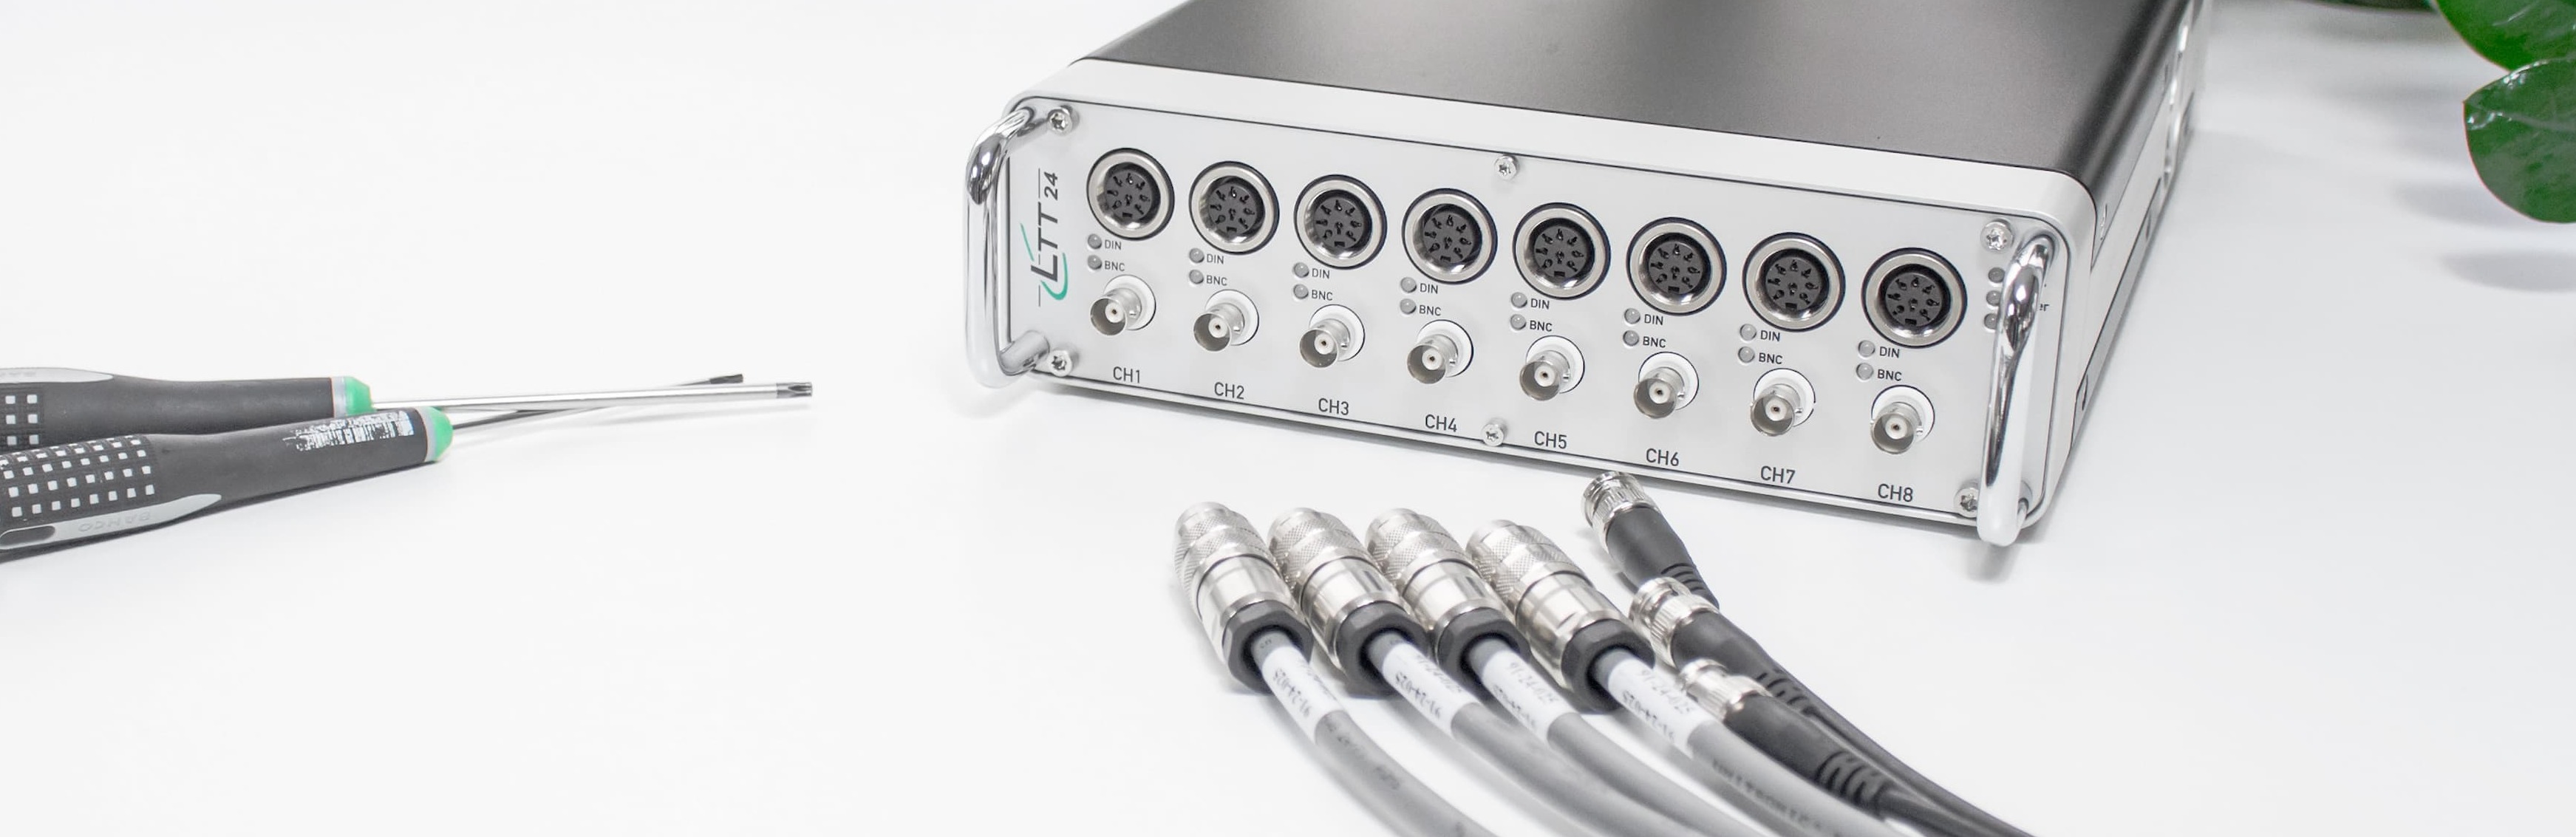
The precision measuring devices from Labortechnik Tasler offer the best analog input stage on the market for this purpose, reducing the distortion of your measurement signals to a minimum!
If there is not only one frequency of interest in a signal to be analyzed, then it must be taken into account that the distortions of slower signal components lead to virtual disturbances that "collide" with higher frequency signal components.
Blasting tests are a spectacular example: a powerful boom produces a shock wave that causes the material of an object being measured to sweat. In a short time, the material's load-bearing capacity is exceeded at some points, and microcracks appear that rapidly expand until the entire object ruptures. These microcracks occur at points where many high-frequency shock components positively overlap each other and add up. If you want to measure this and recalculate the crack positions from the measurement data, you will be surprisingly wrong if you have not previously used the right measuring instrument with a low-distortion input stage. The high frequency components mentioned have very small amplitudes --- compared to the enormous amplitude of the big whopper. Now the distortion hits: the hum produces faster signal noise, also called harmonics. So a big whoosh brings large distortion-disturbance amplitudes at higher frequencies, superimposed on the measurement signals actually present there.
So: Whenever there are [SLOW LARGE] and [fast small] signals at the same time, an extremely low-distortion measuring device must be used!
As already described above, the LTTsmart and LTT24 have by far the best analog input stages on the market! The distortion harmonics of the LTT meters are in sum smaller than 3 ppm of the applied signal. The first harmonic is even smaller than 1 millionth of the input signal. At the same time the devices impress with an incredibly flat noise floor, which is below -140dB over the whole bandwidth from DC to 2 MHz - and that without any internal noise frequencies, which would be noticeable as spikes. This is absolutely unique! As a rule, one's own measurement operation has little in common with blasting tests - but nevertheless the distortion destroys important percentage points of the accuracy statement even in all everyday tasks.
An (almost) arbitrary example of a regular standard measurement is the power measurement at battery driven multi-phase e-motors. Such e-motors are driven by so-called PWM signals, i.e. pulsed signal sequences. The physics defining the losses occurs in the steep edges of these pulse sequences. Fast measurement technology is a must here. And again, the distortion of the large voltage pulses overlays the much smaller and higher frequency signal components that define the losses. If the input stage of the measuring device used distorts these pulse sequences too much, even a fast A/D converter will no longer help to prevent the "virtual interference power losses". The LTTsmart input amplifiers are better bya factor of 100 than all other systems on the market. An advantage that brings between 5% and 7% more accuracy in direct comparison measurements. Mathematically, it can be shown that with a higher sampling rate, the resolution necessarily decreases. Physical laws describe this dependence. If one could build an absolutely perfect preamplifier, the optimum of the mathematical power calculation of PWM signals would be reached at a sampling rate of 2MHz to 4 MHz.
And it is precisely such almost perfect preamplifiers that Labortechnik Tasler GmbH has been developing and using for 25 years. In combination with the high precision 4 MHz A/D converters, the galvanic isolation and the high synchronism of the channels, this is the perfect combination.
While other power analyzer compact systems internally calculate the digitized data to the usual performance parameters and only transmit these slow calculation results to the connected PC, the LTT measuring systems continuously send all measured raw data to the PC using a patented process. Once there, the data is calculated into all conceivable performance parameters using highly optimized algorithms with only a few percent processor utilization. At the same time, the raw data remains available in a ring buffer in the PC, so that higher analysis packages can access the exact underlying raw data at any time in the event of conspicuous performance parameters. Also retroactively.
In this way, the LTTsmart systems, when used as power analyzers, open up the comprehensive analysis of parameter fluctuations of the electric motor test specimens. In industry, it is important not to run such data analyses in an additional software island solution. For this reason, Labortechnik Tasler GmbH offers suitable interfaces to many test bench solutions. These include the test bench software from Gantner Instruments (GI.bench), from Stiegele (m.Lab), from MeasX (DasyLab) and National Instruments (LabView). Of course, there are also interfaces to Python and Matlab, as well as command libraries to customer-specific programs, which can be used under Windows as well as Linux.
The experts at Labortechnik Tasler GmbH are happy to help with any implementation tasks.
Demo devices can also be provided to demonstrate the advantages of the LTTsmart and LTT24 directly in customer projects.